
If life unfolds by chance, then is it possible to measure the likelihood of any given event? Can we predict, even loosely, what will happen next based on what has already occurred?
Take, for instance, a woman who cries every time she watches a drama series. Her emotions respond predictably to the twists and heartbreaks of fictional lives. So, if you recommend another show to her, what are the chances she’ll cry again? Quite high, you’d imagine.
Now consider a man who rarely sheds a tear during such shows. You’ve seen him mostly sit stone-faced through stories that would shatter the strongest hearts. If he watches another random drama, would he cry this time? Unlikely, perhaps. But impossible? Not quite.
So who is more likely to cry — the woman or the man? “The woman, obviously,” you might say. And statistically, you’d be right. If her crying is as reliable as rain in a monsoon and his as rare as snow in the desert, the odds favor her. But here’s the twist: just because the man rarely cries doesn’t mean he never will. Even a probability of 0.001 isn’t zero. That one powerful story, that one perfectly timed scene, could draw out a tear he didn’t know he had.
Probability isn’t fate — it’s merely the shadow of possibility. Low odds don’t erase the chance of something happening; they simply whisper that it’s rare. And sometimes, it’s the rarest moments that strike the deepest chord.
Probability gives us a way to peek into the future — not with certainty, but with informed anticipation. It helps us estimate how likely something is to happen based on the data we’ve gathered. It doesn’t claim to predict exactly what will unfold. Instead, it serves as a compass, offering direction in the chaos of apparent randomness. In doing so, it empowers us to make more thoughtful, informed decisions.
We measure probability on a scale from 0 to 1. A probability of 0 means the event is impossible — it simply won’t happen. A probability of 1 means absolute certainty — it will happen without fail. Between those two extremes lies a spectrum of possibilities, which we often express as fractions, decimals, or percentages.
To visualize probability, we often turn to Venn diagrams. Also known as “set diagrams” or “logic diagrams,” these simple visuals use circles — sometimes overlapping, sometimes not — to represent relationships between different sets or events. With just a few intersecting curves, we can make sense of how outcomes connect, overlap, or stand apart.
We can get the probability of A event below:
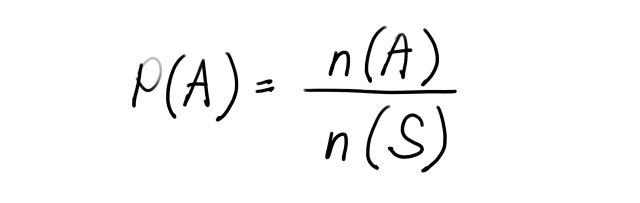
Where:
P(A) — probability of event A happening
n(A) — number of ways getting an event
n(S) — possibility space showing all possible outcomes
To indicate that event A has not occured is represented by A’, which is called complementary event of A. So anything in A can’t be in A’, and vice versa. A and A’ are two separate events. When you add P(A) and P(A’) together, it results 1. Suffice it to say, the chance that something will either be in A or A’ is 100%.
MUTUALLY EXCLUSIVE EVENTS
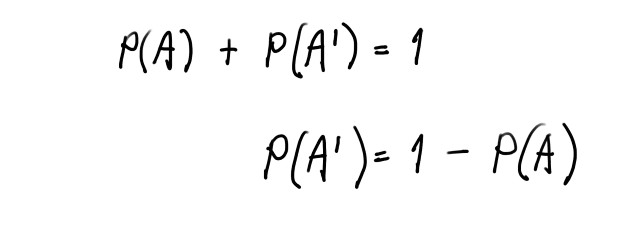
Anything that’s in event A cannot be in event A’, and anything in event A’ cannot be in event A. This means, they are mutually exclusive events. So, when event A and event A’ are added together, it makes up the probability of the entire space, which is 1.
It’s important to note that we don’t always add probabilities like the ones above as it’s only applicable to mutually exclusive events. Mutually exclusive events simply mean something cannot be in A if it’s in A’ and nothing can be in A’ if it’s in A.
Suppose we have a group of smokers and non-smokers. We would like to know the probability of each event. See Venn diagram below.
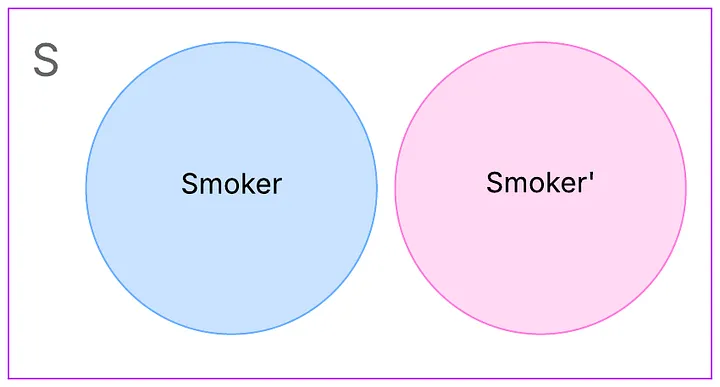
For the union of Smoker and Non-smoker (Smoker U Smoker’), we use “or”, or “U” to unite two sets. If A U B = 1, then they make up the whole of space S, and are said to be “exhaustive.” They exhaust all possibilities.
GIVEN
P(Smoker) = 75%
P(Smoker’) = 25%
SOLUTION
P(Smoker U Smoker') = P(Smoker) + P(Smoker')
                    = 0.75 + 0.25
                    = 1.00
INTERSECTING EVENTS
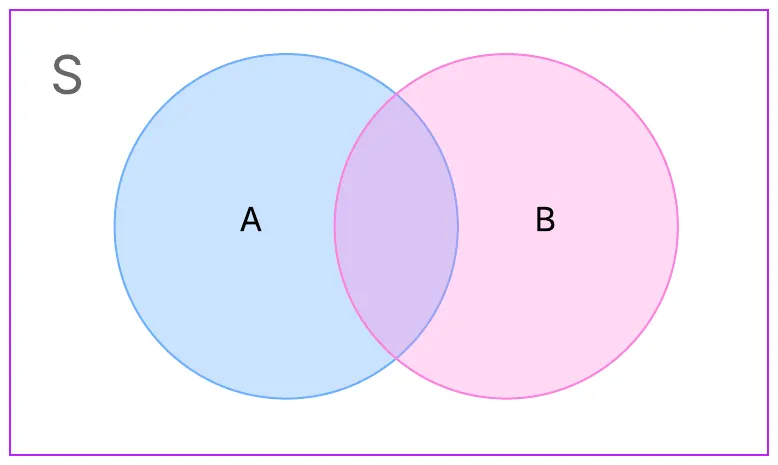
If an event can occur in both event A and event B, then the two events intersect.
So the question is:
Can a person who smokes be an alcoholic?
Can a person who does not smoke be an alcoholic?
Can a person who smokes not be an alcoholic?
Can a person who does not smoke not be an alcoholic?
This is represented by P(A ∩ B) or P(Smoker ∩ Alcoholic).

So if A is represented by smoker and B is represented by a alcoholic, we can calculate union of smoker and alcoholic below
P(Smoker U Alcoholic) = P(Smoker) + P(Alcoholic) - P(Smoker ∩ Alcoholic)It can best be illustrated with a Venn diagram below
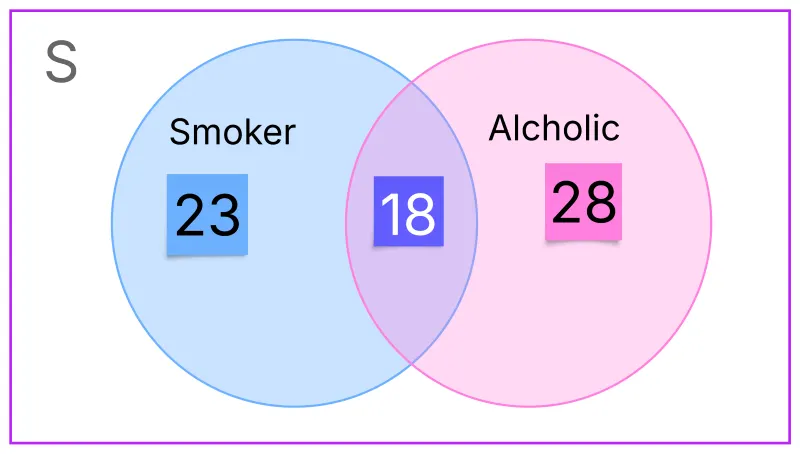
To calculate the probability of union of smoker and alcoholic, which is the probability of the total space, we do it by
P(Smoker U Alcoholic) = P(Smoker) + P(Alcoholic) - P(Smoker ∩ Alcoholic)
                      = (23 / 33) + (28 / 33) - (18 / 33)
                      = 0.70 + 0.85 - 0.55
                      = 1.00
As expected, we get 1.00, which is the whole space in a Venn diagram.
What if we want to know the likelihood that someone is an alcoholic given that they smoke? Or, conversely, the likelihood that someone is an alcoholic given that they don’t smoke? These are compelling questions — and the answers lie in the concept of conditional probability, which we’ll explore in the next article.
In this article, we explored foundational concepts in probability: Venn diagrams, the union and intersection of events, mutually exclusive events, and exhaustive events. Understanding these core ideas sets the stage for deeper insights into what comes next: conditional probability, Bayes’ Theorem, and the Law of Total Probability.